
Before You Dive In —
Consider Your Audience
Reports for Higher Management can be published in a number of ways, depending on what is most convenient for the viewers (a custom dashboard, scheduled reports via email, etc). However the reports are presented, it‘s important to consider your audience when presenting to higher management - brevity and accuracy are a must. People in these roles have limited time - and they are often removed from day-to-day operations in a studio.
Leaders in c-level roles are going to be interested in metrics like year-over-year (YOY) image throughput, potential changes to the budget, and returns on investment (ROI). These budget owners will be far less interested in reporting on things like which stylists are moving fastest on set!
Alternatively, Studio Managers and Producers are more likely to be interested in production reporting, as it relates to their job goals and daily work. Metrics like daily shot counts, sample aging reports, at-risk product timelines, and freelancer performance will be more useful to these "on-the-ground" roles. Check out future chapters for more on Daily Production Monitoring!
Solicit leadership‘s input ahead of time if possible to find out what they‘d like to see - and then set about creating it.
Try It For Yourself
On-Time Delivery Reports
Perhaps the most universal studio goal there is: getting your images completed, and getting them completed on time. Measure this KPI, automate reporting, and seek to improve your rates.
Ready to do it yourself? Access our Interactive Guide to audit your studio‘s data, build KPI reports from templates and more!
Access Interactive GuideOn-Time
Delivery
Report

The Big Picture: On-Time Delivery Rate Reports
Leadership Goal
Improve operational efficiency.
Studio Goal
Deliver 100% of product photography on-time.
KPI
Percentage of total products needing photography that are delivered on or before deadline.
Data Sources
Studio management platform.
(or CSV exports from studio production tracking system).
Dimensions
Product Codes, Related Assets, Photography Deadline Date, Asset Delivery Date.
Metrics
Count of Products with:
An Asset Delivery Date that is not null; An Asset Delivery Date that is equal to or less than Photography Deadline Date; An Asset Delivery Date that is greater than Photography Deadline Date; An Asset Delivery Date that is null and a Photography Deadline Date that is less than "Today."
Report Description
Single number (%) or Pie Chart or Bar Chart.
On-Time Delivery Rate

A simple pie chart can quickly give insight into your rate of On-Time Deliveries versus late deliveries.
On-Time Delivery Count
On-Time Late
If improving your On-Time Delivery Rate is a studio goal, then you‘ll want to see how this KPI is developing over time. Group your deliveries into weeks, and see how things are tracking.

How to Do It Yourself
- 1.There are a few ways to get to this report. A studio management platform, like Creative Force, could be set up pretty easily to provide this report to you automatically using a little configuration. Mainly, you‘d just need to define your starting point ("Sample Received" or "Photography Requested") and your ending point ("Assets Delivered," or "Uploaded to DAM" or "Photography Completed").
- 2.Lacking an "out-of-the-box" solution, the raw data you are looking to make this report will start out with a list of Product Codes that you are responsible for producing (consider this "Column A").
- 3.Next, you‘ll want the Sample Receipt Date for the samples that are related to this list of product codes. Using the Sample Receipt Date ensures that your studio is not measuring time to market for items you never received (i.e., if you‘ve been waiting on a partner to ship you a sample for 6 months, I‘d argue that it is not useful to measure your studio‘s turnaround time for that item, since it is out of your control. A counterpoint would be that it is useful to see outliers like this, with their long time to market, to help surface areas of improvement. It all depends on your goals and your organization!).
- 4.So, now you‘ve got a list of products that your studio produces photography for (Column A), and a list of the date you received samples for these products (Column B). The next piece of data we‘re after is when you can consider the product photography "delivered to market." You‘re essentially looking to see when all of the needed assets for a product have been marked "complete." Depending on the sophistication of your studio management platform and/or your DAM, this column could be very easy or very tricky to ascertain. Essentially, this is a yes/no question - is photography complete, retouching complete, and the asset delivered to the DAM, making it available to market? This yes/no question, "Assets Delivered," is Column C.
- 5.The next piece of data is simple - what is the date/time that the status of Step 4 was changed to yes? Which is to say, what is the Date/Time of your Asset Delivery Date? This delivery/completion date is Column D.
- 6.The final step here is also easy. This is a duration, so it is a formula. The duration of Column B to Column D. This provides you with a length of time, beginning with Sample Receipt (or whatever you decided was your starting point on your "Time to Market" journey) and ending with "Asset Delivered" (or your chosen ending point). This is Column E, your time to market for each product. Take the average of this column to find your Average Time to Market.
Take It a Step Further!
- This is a great report to make a part of regular check-ins with cross functional partners - it shows them you are making their success a metric of your own success! It also keeps you honest about your studio‘s areas for improvement.
- Compare your On-Time Delivery Rate week over week, month over month, or quarterly. Review the jobs or deliveries that were late. What did they have in common? How could they have been better?

Try It For Yourself
Asset Production Throughput by Week
How many assets does your studio produce per week? Per month? Per year? Create and automate this report to get an idea of your studio‘s productivity - and learn how other initiatives impact that productivity.
Ready to do it yourself? Access our Interactive Guide to audit your studio‘s data, build KPI reports from templates and more!
Access Interactive GuideAsset
Production
Throughput by
Week

The Big Picture: Asset Production Throughput by Week Reports
Leadership Goal
Measure and improve production efficiency.
Studio Goal
Provide transparency to the volume of assets being produced weekly.
KPI
Total number of assets being sent to retouching, week over week.
Data Sources
Studio management platform (or CSV exports from studio production tracking system).
Dimensions
Asset File Name; Asset Status; Date of production completion (i.e., the date that the Asset Status reaches "In Retouching."
Metrics
Count of assets.
Report Description
Bar chart.
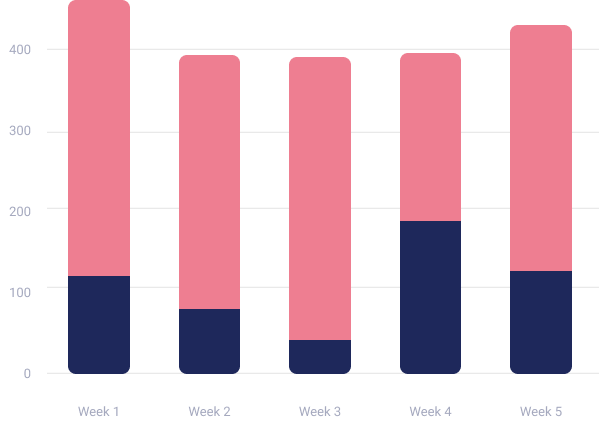
Asset Production Throughput by Week

Usually viewed as a bar chart, Asset Production Throughput can be grouped by day, week, month or year. Quickly see trends, spikes, and dips in your throuhput. Drill down further to investigate the reasons for these changes.

How to Do It Yourself
- 1.Arrange your chart with the x-axis being the Date of Production Completion, grouped by a week.
- 2.Your Y-axis will be a Count of Assets with a value of “Completed.” Your studio may use different terminology, but we‘re looking for a count of assets that were finished along with their date of completion.
- 3.That‘s it! This chart is available out-of-the-box with systems like Creative Force, but you can also manually create it in Excel as a Pivot Table or Bar Chart.
Try It For Yourself
Average Time to Market
Speed to market is more important than ever in today‘s competive world - and it‘s also a goal of nearly every brand and studio out there. Sounds like a prime candidate for a studio KPI!
Ready to do it yourself? Access our Interactive Guide to audit your studio’s data, build KPI reports from templates and more!
Access Interactive GuideAverage Time
to Market
The Big Picture: Average Time to Market Report
Leadership Goal
Reduce time to market; improve GTM
Studio Goal
Meet a delivery time SLA with clients or partners. Or, your goal could be to measure performance and set a baseline to gauge future performance.
KPI
Duration of time from an agreed upon starting point (usually product conception or "handoff" to the photo studio) to an agreed upon end point (usually an asset upload the DAM, making it available “to market” from the photo studio‘s perspective).
Data Sources
Studio management platform (or CSV exports from studio production tracking system). In the absence of a studio management platform, this info could be found in your PIM (product info), your sample tracking system (sample receipt dates), and your DAM (asset delivery times).
Dimensions
Product Code, Sample Received Date, Asset Status, Asset Delivery Date (date when asset status is changed to complete).
Metrics
Count of Products, Count of Products with Photography Complete, Duration between Sample Receipt and Asset Delivery.
Report Description
Numeric; an average duration of time (i.e., "two weeks" or "thirty-six hours and forty two minutes").
How to Do It Yourself
- 1.There are a few ways to get to this report. A studio management platform, like Creative Force, could be set up pretty easily to provide this report to you automatically using a little configuration. Mainly, you‘d just need to define your starting point ("Sample Received" or "Photography Requested") and your ending point ("Assets Delivered," or "Uploaded to DAM" or "Photography Completed").
- 2.Lacking an "out-of-the-box" solution, the raw data you are looking to make this report will start out with a list of Product Codes that you are responsible for producing (consider this "Column A").
- 3.Next, you‘ll want the Sample Receipt Date for the samples that related to this list of product codes. Using the Sample Receipt Date ensures that your studio is not measuring time to market for items you never received (i.e., if you‘ve been waiting on a partner to ship you a sample for 6 months, I‘d argue that it is not useful to measure your studio‘s turnaround time for that item, since it is out of your control. A counterpoint would be that it is useful to see outliers like this, with their long time to market, to help surface areas of improvement. It all depends on your goals and your organization!).
- 4.So, now you‘ve got a list of products that your studio produces photography for (Column A), and a list of the date you received samples for these products (Column B). The next piece of data we‘re after is when you can consider the product photography "delivered to market." You‘re essentially looking to see when all of the needed assets for a product have been marked "complete." Depending on the sophistication of your studio management platform and/or your DAM, this column could be very easy or very tricky to ascertain. Essentially, this is a yes/no question - is photography complete, retouching complete, and the asset delivered to the DAM, making it available to market? This yes/no question, "Assets Delivered," is Column C.
- 5.The next piece of data is simple - what is the date/time that the status of Step 4 was changed to yes? Which is to say, what is the Date/Time of your Asset Delivery Date? This delivery/completion date is Column D.
- 6.The final step here is also easy. This is a duration, so it is a formula. The duration of Column B to Column D. This provides you with a length of time, beginning with Sample Receipt (or whatever you decided was your starting point on your "Time to Market" journey) and ending with "Asset Delivered" (or your chosen ending point). This is Column E, your time to market for each product. Take the average of this column to find your Average Time to Market.
Take It a Step Further!
- Time to market is a big focus of leadership and an important part of successful operations - after dialing in this KPI report, work to decrease it! The less work (read: samples and shoot requests) are piling up, the more successful your studio will be!
- Some aspects of Time to Market may be out of the hands of people directly in the studio, like external post-production for example. If your time to market is higher than you‘d like, think about tools, processes, or even vendors that could help change that.
- Combine this report with others for more actionable intelligence!This report might show you that your Average Time to Market is a four day turnaround time. If you have access to Flow reporting (which we‘ll discuss in an upcoming chapter), you can see how long each step of your process takes. Perhaps your team shoots items within 24 hours but has to wait 2 days for your external retouching team, delivering assets on the 4th day. The combo of these two reports can provide you with action items on reducing this time to market (like seeking a new vendor, negotiating a new SLA, retouching in-house, or anything else to reduce that bottleneck!).
- While an average time (like "2 days, 12 hours") is useful, seeing the average times week over week, or month over month, is even better! Set up a bar or line chart that groups (makes a series) out of delivery dates in the same week or month. This way, you can see how your average is changing over time! You can also drill down into these reports for more insight into why some weeks are better than others, figuring out what IS working (and what ISN‘T working).


Want the eBook?
Our comprehensive guide to KPIs, Reporting, and Dashboards is available as an eBook.
Sign up now and we'll send you a copy to your email.